1. Ticketing Statistics
1.1 Available graphs
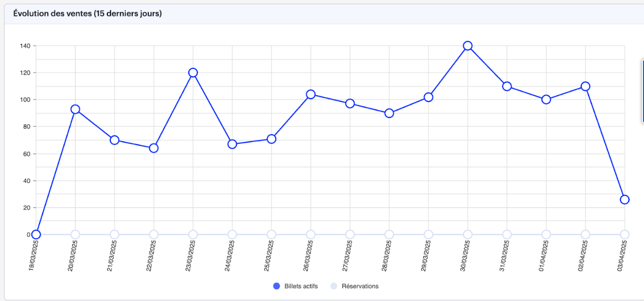
Charts are available to help you stay on top of your project and optimize your communication.
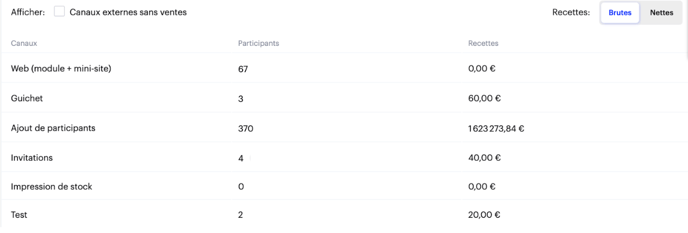
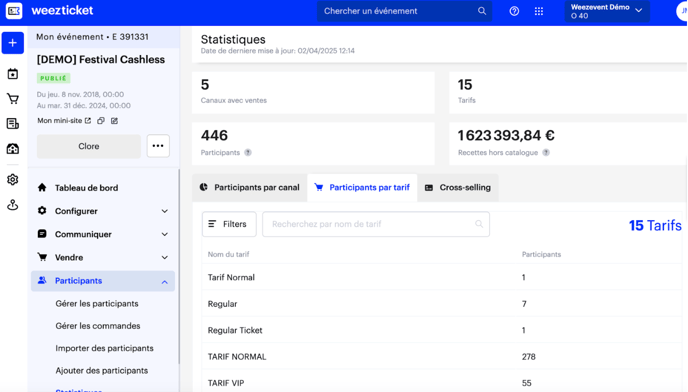
You can access detailed information about sales trends based on the number of participants, time of year, sales channel, or pricing options.
1.2 Your event’s communication
These various statistics will allow you to analyze your event more effectively, taking into account the sales channels used, ticket types, and overall performance, with the goal of improving your communication strategies.
2. Access control statistics
If you would like to view detailed statistics on access control, we invite you to consult the article dedicated to participation reports and scan history reports.
There, you will find all the necessary information to track entries, analyze attendance data, and gain a better understanding of activity at your access points.